Dutch Bros Q3 2025 earnings make a bold claim: this is no longer a regional growth story. It’s a scalable, transaction-driven machine with expanding margins, rising productivity, and a disciplined path toward 2,029 shops by 2029. The question for investors isn’t whether growth exists. It’s whether that growth is durable.
Dutch Bros Q3 2025 Earnings Snapshot
- Dutch Bros reported Q3 revenue of $424 million, up 25% year over year. System same-shop sales increased 5.7%, driven by 4.7% transaction growth.
- Adjusted EBITDA totaled $78 million, rising 22% year over year, with adjusted EPS of $0.19. Company-operated shop contribution margin was 27.8%.
- System-wide average unit volumes reached new highs. The company ended the quarter with 1,081 shops after opening 38 locations.
- Digital engagement continued to scale, with Order Ahead at 13% of transactions and Dutch Rewards driving 72% of system sales.
- Liquidity stood at $706 million, including $267 million in cash. Full-year revenue guidance was raised; EBITDA guidance remained $285–$290 million.
The company’s performance and forward commentary are detailed in Dutch Bros Inc. Q3 2025 earnings materials, including the earnings press release and investor presentation.
This quarter offers meaningful evidence that it is.
Revenue climbed 25%. Transactions grew for the fifth consecutive quarter. Average unit volumes hit record levels. And management raised full-year guidance while accelerating development visibility.
But numbers alone don’t explain the story. The deeper narrative lies in how Dutch Bros drives growth — and why the model appears increasingly self-reinforcing as it scales.
Let’s unpack what really mattered in Q3.
Table of Contents
Traffic Is Driving Growth, Not Pricing
At the center of Dutch Bros’ performance this quarter was traffic — not pricing.
Third quarter revenue reached $424 million, up 25% year over year. System same-shop sales rose 5.7%, driven primarily by 4.7% transaction growth. Company-operated same-shop sales were even stronger at 7.4%, with 6.8% coming from transactions.
That distinction matters.
In an environment where many restaurant operators rely heavily on pricing to maintain comps, Dutch Bros is generating growth through customer frequency and brand engagement. Price contributed roughly 2 points to comp, but mix partially offset it. This is a traffic story.
Management emphasized that this marks the fifth consecutive quarter of transaction growth. That consistency stands out in today’s discretionary spending landscape, particularly among younger consumers — a demographic many brands cite as under pressure.
Dutch Bros is seeing the opposite.
Loyalty Is Reinforcing Frequency
Roughly 72% of system transactions now come through Dutch Rewards, giving the company a powerful segmentation engine. According to management, younger cohorts within the loyalty base are performing strongly, suggesting that the brand’s emotional connection continues to resonate even amid macro noise.
This isn’t accidental. The company’s strategy layers multiple transaction-driving initiatives — digital ordering, paid media, food expansion, loyalty segmentation — that reinforce one another. That stacking effect is what’s beginning to show up clearly in the numbers.
Importantly, October trends continued strong, supporting raised full-year same-shop sales guidance of approximately 5%.
Momentum is not fading into Q4.
Quarter at a Glance: What Actually Mattered in Q3
- Growth quality improved. Revenue rose 25% to $424 million, but more importantly, 4.7% system-wide transaction growth drove results, confirming demand strength without heavy reliance on pricing.
- Traffic proved durable. Company-operated same-shop sales increased 7.4%, marking a fifth consecutive quarter of transaction expansion and reinforcing that customer frequency remains resilient even as conditions normalize.
- Infrastructure continued to scale. Order Ahead reached 13% of transactions and Dutch Rewards accounted for 72% of system sales, strengthening predictability, segmentation, and attachment opportunities.
- Expansion remained disciplined. The system reached 1,081 shops after 38 openings, while site approvals accelerated, extending multi-year development visibility toward the 2,029-shop target.
- Margins reflected investment, not weakness. Shop contribution margin held at 27.8% despite higher coffee, labor, and food costs, as the company prioritized long-term execution over short-term optimization.
Why Q3 Matters More Than Q2
Q3 matters not because it exceeded Q2, but because it clarified the durability of the Dutch Bros model.
The second quarter showcased how powerful the business can look when multiple tailwinds align. The third quarter tested whether that momentum could persist as conditions normalized.
Q2 Showed the Upside When Conditions Align
Q2 set a high bar. Revenue grew 28%, system same-shop sales increased 6.1%, and adjusted EBITDA expanded 37%.
Promotions performed well. Dairy costs were favorable. New shops opened with strong early productivity. Demand, cost structure, and operating leverage all moved in the same direction.
Q2 illustrated the upside of the model when execution and external conditions reinforce one another.

Q3 Confirmed Demand Without Relying on Tailwinds
Q3 did not replicate the same margin profile — and that distinction is the point.
Revenue growth moderated to 25%, and same-shop sales eased to 5.7%. At the same time, transaction growth accelerated to 4.7%, marking the fifth consecutive quarter of traffic expansion.
Unlike Q2, results were achieved as coffee costs increased and investment levels rose. Traffic continued to do the work even as promotional and cost tailwinds faded.
That shift in mix matters. It signals that the underlying demand is holding rather than being pulled forward by favorable conditions.
Q3 Marked a Transition Toward Structural Growth
Beyond the headline numbers, Q3 advanced the systems that support long-term scale.
Order Ahead penetration increased to 13% of transactions. The food program expanded to roughly 160 shops with measurable comp lift. Development visibility improved as pipeline approvals accelerated.
Margins compressed as the company invested in training, new markets, and food capability. Those pressures reflect scaling activity, not demand weakness.
Viewed together, the distinction becomes clear. Q2 demonstrated how much leverage the model can generate under ideal conditions. Q3 demonstrated that Dutch Bros can sustain transaction momentum while building infrastructure and absorbing cost headwinds.
That transition is subtle but important. It suggests the company’s 2025 performance is becoming less about favorable timing and more about repeatable execution.
For a deeper comparison of operating leverage and promotional dynamics earlier in the year, review Dutch Bros Q2 2025 earnings analysis to assess how transaction trends evolved into Q3.
Record AUVs and a 2,029-Shop Vision
Unit economics remain one of the most compelling aspects of the Dutch Bros model.
System-wide average unit volumes reached record levels in Q3. While management did not disclose the exact AUV figure on the call, the tone was clear: new shops are performing at or above historical productivity levels, even as the company expands into the Midwest and Southeast.

That geographic portability is critical.
Development Visibility Extends Multiple Years
Dutch Bros now operates 1,081 shops across 24 states after opening 38 locations in Q3. Management reaffirmed its long-term goal of reaching 2,029 shops by 2029 and provided additional visibility into development cadence:
- 160 system shop openings targeted for 2025
- Approximately 175 projected openings in 2026
- Pipeline additions averaging 30+ approved sites per month over the past six months
The pipeline commentary is particularly telling. Many of the sites being approved today will open in 2027 and 2028. That forward build gives Dutch Bros unusually strong multi-year visibility compared to peers.
CapEx per shop averaged $1.4 million in Q3, reflecting a shift toward more capital-efficient build-to-suit lease arrangements. That matters for return on invested capital and supports the company’s confidence in self-funded growth over time.
At scale, shop-level economics remain attractive. Company-operated shop contribution margin came in at 27.8% despite commodity and labor pressures. For a drive-thru beverage concept with national expansion ambitions, that margin profile is robust.
The story here is not just growth. It’s disciplined growth supported by healthy four-wall returns.
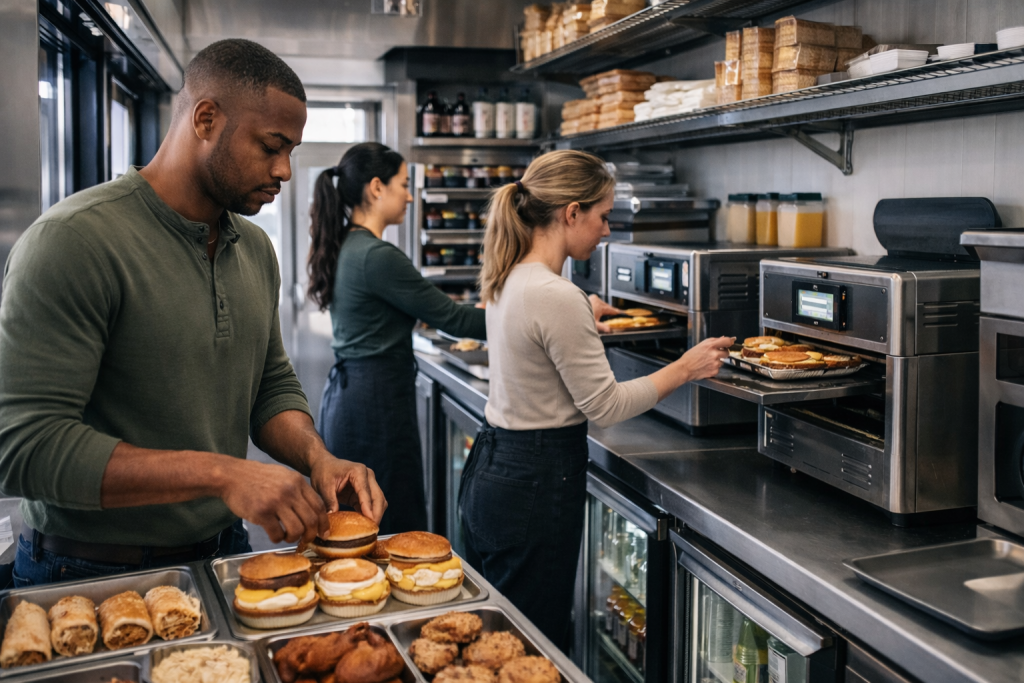
Food Is No Longer a Pilot — It’s Becoming a Platform
Food may be the most underappreciated lever in Dutch Bros’ current model.
By the end of Q3, hot food had rolled out to approximately 160 shops. Early results suggest a roughly 4% comp lift in food-enabled stores. Notably, about one-quarter of that lift comes from transaction growth, while the remainder comes from ticket and attachment.
That mix is encouraging.
Management had originally questioned whether adding food might cannibalize beverage occasions. Instead, food appears to be incremental, particularly in the morning daypart where Dutch Bros sees opportunity.
Operationally, the company designed the program carefully:
- Oven cycle times are shorter than average beverage make times, preserving throughput.
- Labor investments scale with sales growth.
- Equipment and training were built into the rollout process.
There is near-term margin pressure. Food carries higher COGS than beverage, and management expects modest cost headwinds as rollout expands through 2026. Approximately 25% of year-end 2025 shops cannot accommodate hot food due to layout constraints, though that percentage declines over time as new builds include the capability.
What matters strategically is this: food establishes infrastructure.
Today’s eight SKUs are just the starting point. The installation of ovens, inventory systems, and operational capabilities creates optionality for future menu expansion. This is less about muffins and more about broadening the daypart relevance of the brand.
As management framed it, this is the beginning of a longer runway.
Digital Flywheel: Order Ahead and Dutch Rewards
Digital engagement is quietly becoming one of Dutch Bros’ strongest competitive advantages.
Order Ahead Is Improving Predictability
Order Ahead mix reached 13% system-wide in Q3, with some new markets nearing double that level. Importantly, this adoption has been largely customer-driven rather than heavily promoted.
Why does that matter?
Because digital penetration improves operational predictability and enhances attachment opportunities — particularly with food. It also feeds directly into Dutch Rewards, which now accounts for 72% of system transactions, up 5 points year over year.
Dutch Rewards Is Becoming a Segmentation Engine
The company has shifted from broad-based promotions to segmented offers, improving marketing efficiency while protecting margin. Management emphasized that Q3 transaction growth occurred with “almost exclusively segmented offers,” suggesting organic engagement strength rather than heavy discounting.
Paid advertising is serving as the top-of-funnel brand awareness driver. Loyalty serves as the retention and frequency engine. Order Ahead enhances convenience and attachment. Food boosts morning daypart relevance.
These pieces are not independent.
They reinforce one another.
As the digital ecosystem matures, the company’s ability to target cohorts, personalize offers, and drive incremental visits should improve. That analytical sophistication is still in early innings, according to management.
For a brand only four years removed from its IPO, the digital backbone looks increasingly scaled.
Margin Dynamics and Cost Pressures

Strong growth does not eliminate cost realities.
Adjusted EBITDA reached $78 million in Q3, up 22% year over year. Adjusted EPS rose 19% to $0.19. However, margin headwinds are building into Q4 and potentially into 2026.
Key pressures include:
- Coffee costs rising and expected to remain elevated
- Food COGS higher than beverage
- 50 basis points of labor impact in Q4 due to California payroll tax changes
- Higher occupancy costs as new build-to-suit leases enter the portfolio
- Elevated preopening expenses tied to aggressive development
These factors explain why management raised revenue guidance but held adjusted EBITDA guidance steady at $285–$290 million for the year.
The decision reflects investment, not deterioration.
Preopening expenses increased as training teams supported strong new market openings. Management appears willing to absorb near-term expense to protect long-term execution quality.
Adjusted SG&A continues to leverage, with an expected 110 basis points of improvement for the full year. That signals that central overhead is scaling appropriately against revenue growth.
Liquidity remains strong at $706 million, including $267 million in cash and $440 million in undrawn revolver capacity. Net cash improved sequentially by $14 million in Q3.
The balance sheet is not constraining expansion.
Culture as Competitive Infrastructure

Dutch Bros’ leadership repeatedly returned to culture as the foundation of the model.
That language can sound soft. But at scale, culture functions as operational infrastructure.
The company has more than 475 operators in its pipeline, with an average tenure of 7.5 years. That internal promotion engine enables expansion into new markets with experienced culture carriers rather than external hires.
Recognition metrics reinforce the narrative. Dutch Bros ranked #1 in order accuracy, satisfaction, and beverage quality among beverage players in the 2025 InTouch Insight QSR drive-thru report and topped Forbes’ 2026 Best Customer Service list in its category.
These accolades are not just branding exercises. In a drive-thru format dependent on speed and customization, execution consistency is revenue protection.
As the system scales toward 2,000 units, the true test will be maintaining this cultural cohesion. For now, the operator pipeline and listening mechanisms described by management suggest deliberate guardrails.
What Dutch Bros Q3 2025 Earnings Really Show
Dutch Bros Q3 2025 earnings do more than demonstrate strong quarterly performance. They reveal a model that is layering growth drivers rather than relying on a single lever.
Transactions are rising. Digital engagement is deepening. Food is expanding daypart reach. Development visibility extends multiple years forward. Unit economics remain compelling. Liquidity supports acceleration.
Cost pressures are evident, particularly in coffee and labor. But these appear manageable within the broader growth trajectory.
The most important takeaway is structural: Dutch Bros is transitioning from a high-growth regional chain into a national-scale beverage platform with multiple reinforcing engines.
That trajectory was reinforced shortly after quarter-end, when Dutch Bros Inc. released its fourth-quarter and full-year 2025 financial results, confirming continued transaction momentum, disciplined expansion, and sustained investment in long-term growth.
For more insight into how rising coffee costs and food rollout investments impacted the fourth quarter, see Dutch Bros Q4 2025 earnings analysis, which examines full-year profitability trends.
If the company executes on its path toward 2,029 shops in 2029 while maintaining transaction momentum and cultural consistency, the growth algorithm becomes less speculative and more mechanical.
The Q3 numbers suggest that shift is already underway.
Key Takeaways
Dutch Bros Q3 2025 earnings demonstrate that transaction growth, not pricing, is the primary driver of performance, reinforcing the durability of underlying customer demand.
The company is transitioning from favorable-condition growth to structurally supported growth, with digital engagement, food expansion, and development visibility reinforcing one another.
Unit economics remain strong, with record average unit volumes and resilient shop-level margins supporting a multi-year expansion plan toward 2,029 locations.
Digital infrastructure is evolving into a competitive advantage, as Dutch Rewards and Order Ahead deepen engagement while improving marketing efficiency.
Margin pressures are emerging from coffee costs, food rollout, and development investment, but liquidity and SG&A leverage indicate the balance sheet supports continued expansion.
Investor FAQs
What drove revenue growth in Dutch Bros Q3 2025 earnings?
Revenue increased 25% year over year, primarily driven by transaction growth rather than pricing. System same-shop sales rose 5.7%, with most of that growth coming from higher customer traffic.
How significant was transaction growth in the quarter?
Transaction growth reached 4.7% system-wide and 6.8% in company-operated stores. This marked the fifth consecutive quarter of traffic expansion, signaling consistent customer engagement.
How is food contributing to performance?
Hot food expanded to approximately 160 shops and generated an estimated 4% comp lift in those locations. The lift was driven by both increased transactions and higher average tickets.
What role does digital play in the growth model?
Order Ahead reached 13% of transactions, and Dutch Rewards accounted for 72% of system sales. These tools support customer segmentation, frequency, and operational predictability.
What are the primary margin pressures going forward?
How strong is the development pipeline?
The company operates 1,081 shops and plans 160 openings in 2025 and roughly 175 in 2026. Site approvals averaging over 30 per month provide multi-year development visibility.
Get More Earnings Breakdowns and Investor Insights
This site is built for investors who want straightforward, in-depth breakdowns of earnings calls—without the jargon. Whether you follow SoFi, Amazon, Dutch Bros, or other high-growth names, we’ve got you covered. Explore our latest posts and stay tuned—new recaps and insights drop regularly.
Check out our dedicated Dutch Bros page for all the latest posts and deep‑dives, from earnings breakdowns to fresh analyst takes—bookmark it and never miss a beat.
Written by Bryan Smith, creator of Straight From the Call.
I break down earnings calls so you don’t have to. Clear takeaways, no fluff — just the stuff investors care about.This post is for informational and educational purposes only. It does not constitute financial, investment, or legal advice. Always do your own research or consult a licensed professional before making financial decisions. For the full policy, see our Not Investment Advice & Disclosure Statement